



4.1 Introduction and ERP Overview
Welcome to the HNN ERP tutorial!
This walkthrough is designed to teach you to use both the Graphical User Interface (GUI) and the Python API. In the sections that follow, the videos will guide you through how to use the HNN GUI, and the web pages themselves will include code blocks that mimic the GUI workflow in the Python API. Note that there will be slight deviations between what is covered in the GUI versus the API, as the API includes some features that are not available in the GUI. In general, though, we maintain close parity between the GUI and API tutorials, such that you can choose whichever method you prefer without missing any essential content.
In order to understand the workflow and initial parameter sets provided with this walkthrough, we recommend that you watch the ERP overview video below. We additionally provide a brief scientific background in the accompanying text below, but note that the video overview provides a more comprehensive introduction.
You will need a working installation of hnn-core to following along with the walkthrough. If you have not yet installed HNN, the subsequent page 4.2: Following Along, will guide you through the necessary steps.
Overview Video
Experimental Background in Brief
To understand the tutorials that follow, we must briefly describe prior studies that led to the creation of the provided data and evoked response parameter sets that you will work with. This tutorial is based on results from our 2007 study where we recorded and simulated tactile evoked responses source localized to the primary somatosensory cortex (SI) (Jones et al., 2007) using the implementation of the network from (Neymotin et al., 2020).
In our 2007 study, we investigated the early evoked activity (0-175 ms) elicited by a brief tap to the D3 digit and source localized to an an equivalent current dipole in the contralateral hand area of the primary somatosensory cortex (SI) (Jones et al., 2007). The strength of the tap was set at either suprathreshold (100% detection probability) or perceptual threshold (50% detection) levels (see Figure 1, left panel, below). Note, to be precise, this data represents source-localized event related field (ERF) activity collected using MEG. We use the terminology event-related potential (or “ERP”) for simplicity, since the primary current dipoles generating evoked fields and potentials are the same.
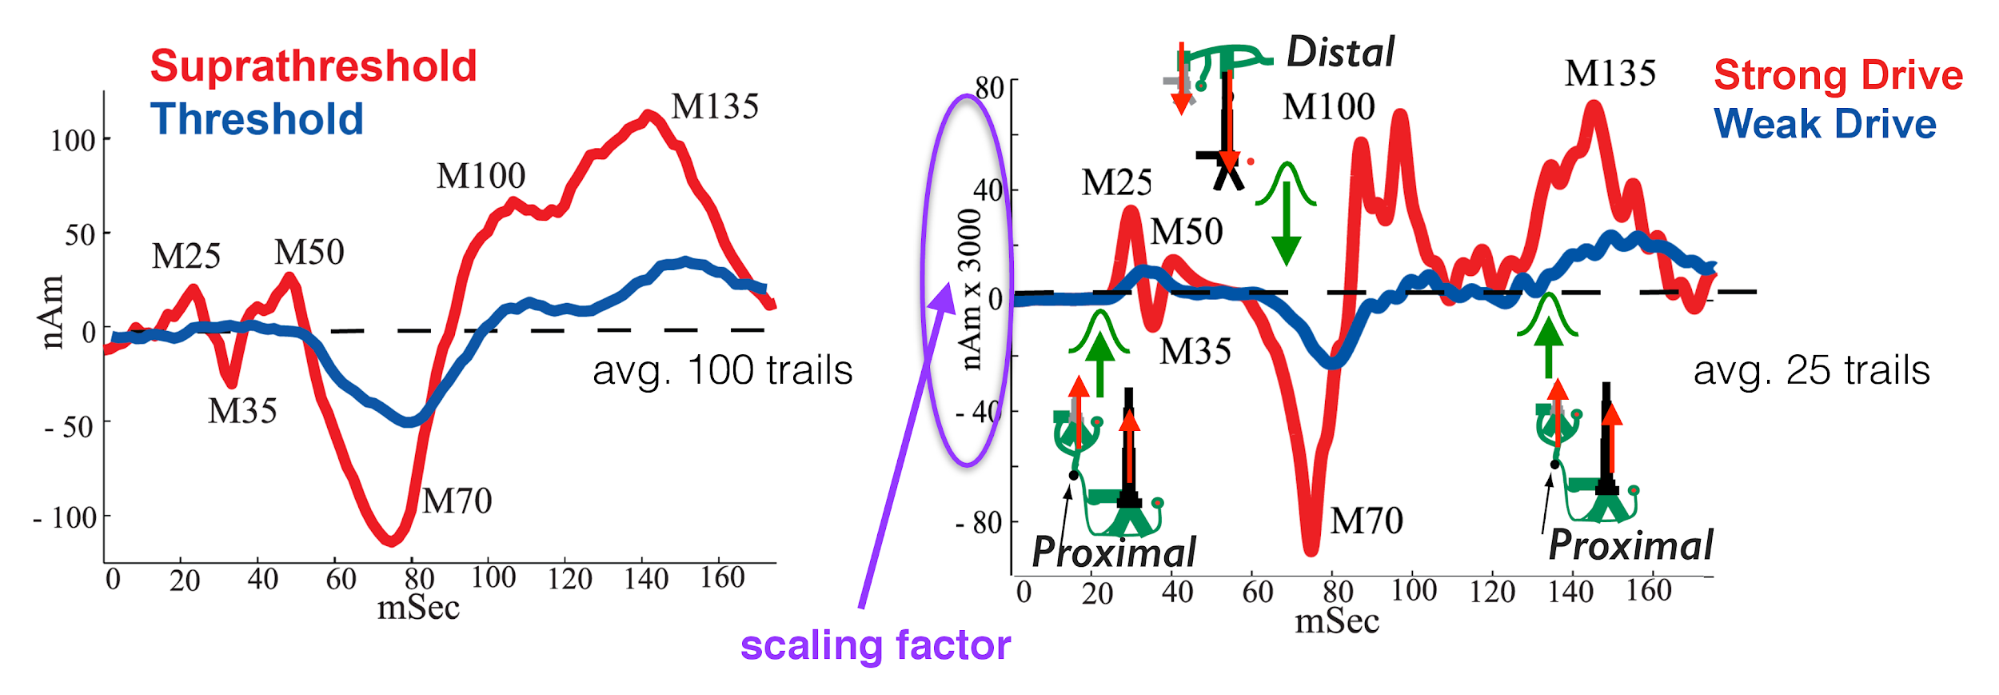 Figure 1: Adapted from (Jones et al. 2007). Comparison of SI evoked response in experiment and neural model simulation. Left: MEG data showing tactile evoked response (ERP) source localized to the hand area of SI. Red: suprathreshold stimulation; Blue: threshold stimulation (avg. n=100 trials). Right: Neural model simulation depicting proximal/distal inputs needed to replicate the ERP waveform (avg. n=25 trials)
We found that we could reproduce evoked responses that accurately reflected the recorded waveform in our neocortical model from a layer-specific sequence of exogenous excitatory synaptic drive to the local SI circuit (see Figure 1, right panel, below).
This drive sequence consisted of “feedforward” (a.k.a. “proximal”) input at ~25 ms post-stimulus, followed by “feedback” (a.k.a. “distal”) input at ~60 ms, followed by a subsequent feedforward (proximal) input at ~125 ms (with a Gaussian distribution of input times on each simulated trial). This sequence of drive generated spiking activity and intracellular dendritic current flow in the pyramidal neuron dendrites to reproduce the current dipole signal. This sequence of drives can be interpreted as initial feedforward input from the lemniscal thalamus, followed by feedback input from higher-order cortex or non-lemniscal thalamus, followed by a re-emergent leminsical thalamic drive. Intracranial recordings in non-human primates motivated and supported this assumption (Cauller & Kulics, 1991).
In our model, the exogenous driving inputs were simulated as predefined trains of action potentials (pre-synaptic spikes) that activated excitatory synapses in the local cortical circuit in proximal and distal projection patterns (i.e., feedforward and feedback, respectively, as shown schematically in Figure 1, right panel). The number, timing, and strength (i.e., post-synaptic conductance) of the driving spikes were manually adjusted in the model until a close representation of the data was found (all other model parameters were tuned and fixed based on the morphology, physiology, and connectivity within layered neocortical circuits (Jones et al., 2007)). Note that a scaling factor was applied to the net dipole output to match to the magnitude of the recorded ERP data and used to predict the number of neurons contributing to the recorded ERP (purple circle, Figure 1, right panel). The dipole units were in nAm, with a one-to-one comparison between data and model output due to the biophysical detail in our model.
In summary, to simulate the SI evoked response, a sequence of exogenous excitatory synaptic drives was simulated (by creating presynaptic spikes that activate layer-specific synapses in the neocortical network) consisting of proximal drive at ~25 ms, followed by distal drive at ~60 ms, followed by a second proximal drive at ~122 ms.
Given this background information, subsequent sections will walk you through the steps of simulating similar ERPs, starting with a subset of the data shown in Figure 1.
References
Cauller, L. J. & Kulics, A. T. The neural basis of the behaviorally relevant N1 component of the somatosensory-evoked potential in SI cortex of awake monkeys: evidence that backward cortical projections signal conscious touch sensation. Exp. Brain Res. 84, 607–619 (1991). https://doi.org/10.1007/BF00230973
Jones, S. R., Pritchett, D. L., Stufflebeam, S. M., Hämäläinen, M. & Moore, C. I. Neural correlates of tactile detection: a combined magnetoencephalography and biophysically based computational modeling study. J. Neurosci. 27, 10751–10764 (2007). https://doi.org/10.1523/JNEUROSCI.0482-07.2007
Neymotin, Samuel A., Dylan S. Daniels, Blake Caldwell, et al. 2020. “Human Neocortical Neurosolver (HNN), a New Software Tool for Interpreting the Cellular and Network Origin of Human MEG/EEG Data.” eLife 9 (January): e51214. https://doi.org/10.7554/eLife.51214