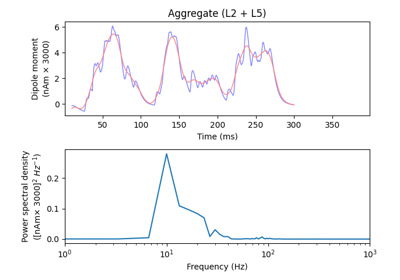
hnn_core.viz.plot_psd#
- hnn_core.viz.plot_psd(dpl, *, fmin=0, fmax=None, tmin=None, tmax=None, layer='agg', color=None, label=None, ax=None, show=True)[source]#
Plot power spectral density (PSD) of dipole time course
Applies
periodogramfrom SciPy withwindow='hamming'. Note that no spectral averaging is applied across time, as mosthnn_coresimulations are short-duration. However, passing a list of Dipole instances will plot their average (Hamming-windowed) power, which resembles the Welch-method applied over time.- Parameters:
- dplinstance of Dipole | list of Dipole instances
The Dipole object.
- fminfloat
Minimum frequency to plot (in Hz). Default: 0 Hz
- fmaxfloat
Maximum frequency to plot (in Hz). Default: None (plot up to Nyquist)
- tminfloat or None
Start time of data to include (in ms). If None, use entire simulation.
- tmaxfloat or None
End time of data to include (in ms). If None, use entire simulation.
- layerstr, default ‘agg’
The layer to plot. Can be one of ‘agg’, ‘L2’, and ‘L5’
- colorstr or tuple or None
The line color of PSD
- labelstr or None
Line label for PSD
- axinstance of matplotlib figure | None
The matplotlib axis.
- showbool
If True, show the figure
- Returns:
- figinstance of matplotlib Figure
The matplotlib figure handle.